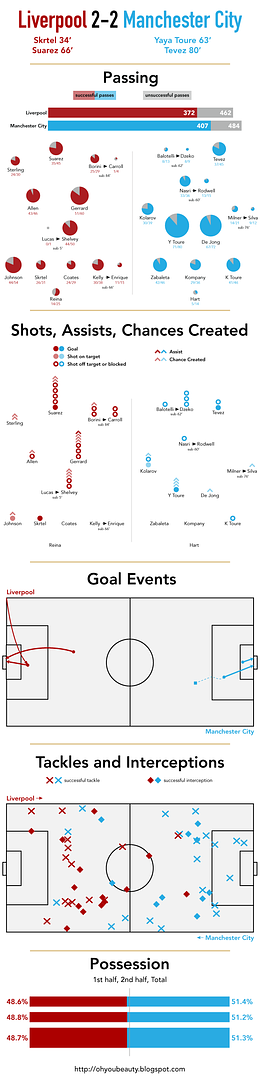
Well, I promised to do these comprehensive infographics for all the "big" matches. I guess I can't stop after one because the second big match went so comprehensively awful. And no, I still haven't come up with a better title for the series.
As with last week's, all data via StatsZone and Squawka.
A couple of notes after the image...

This graphic seems to serve even more of a purpose than last week's against City. Because it makes it obvious how Arsenal won the game: midfield passing, a sturdy defense, and taking its chances.
Liverpool attempted and completed more passes – and a higher percentage of passes – and had more possession, but Arsenal's midfield put Liverpool's to shame. Arteta and Diaby controlled the game, while it felt like Cazorla could score or create a goal every time he waltzed into the final third. 72 passes, 65 completed is an egregious, egregious total for an attacking midfielder and again helps demonstrate just how much Liverpool missed Lucas' ability to cover that area of the pitch.
The tackles and interceptions section is almost as frightening. Especially as you near the penalty boxes. Arsenal's is ringed and filled with tackles and interceptions. Liverpool made one tackle inside its box and three inside the defensive third; nine of Liverpool's 17 tackles came in the opposition half.
Finally, every outfield Liverpool player – all 12 of them, starter and substitute – took at least one shot or created at least one chance. But once again, Liverpool wasted every single one. Seven of Arsenal's 13 outfield players created a chance or took a shot, but they made two of theirs count.